AI-POWERED DOCS
What do you want to know?
I/O Live Monitor
The I/O Live Monitor is a logic analyser for the camera's signals. It shows GPIO pins and PLC handshake bits toggling in real time, which is how you settle the question every integration eventually asks: is the camera not triggering, or is the PLC not asking?
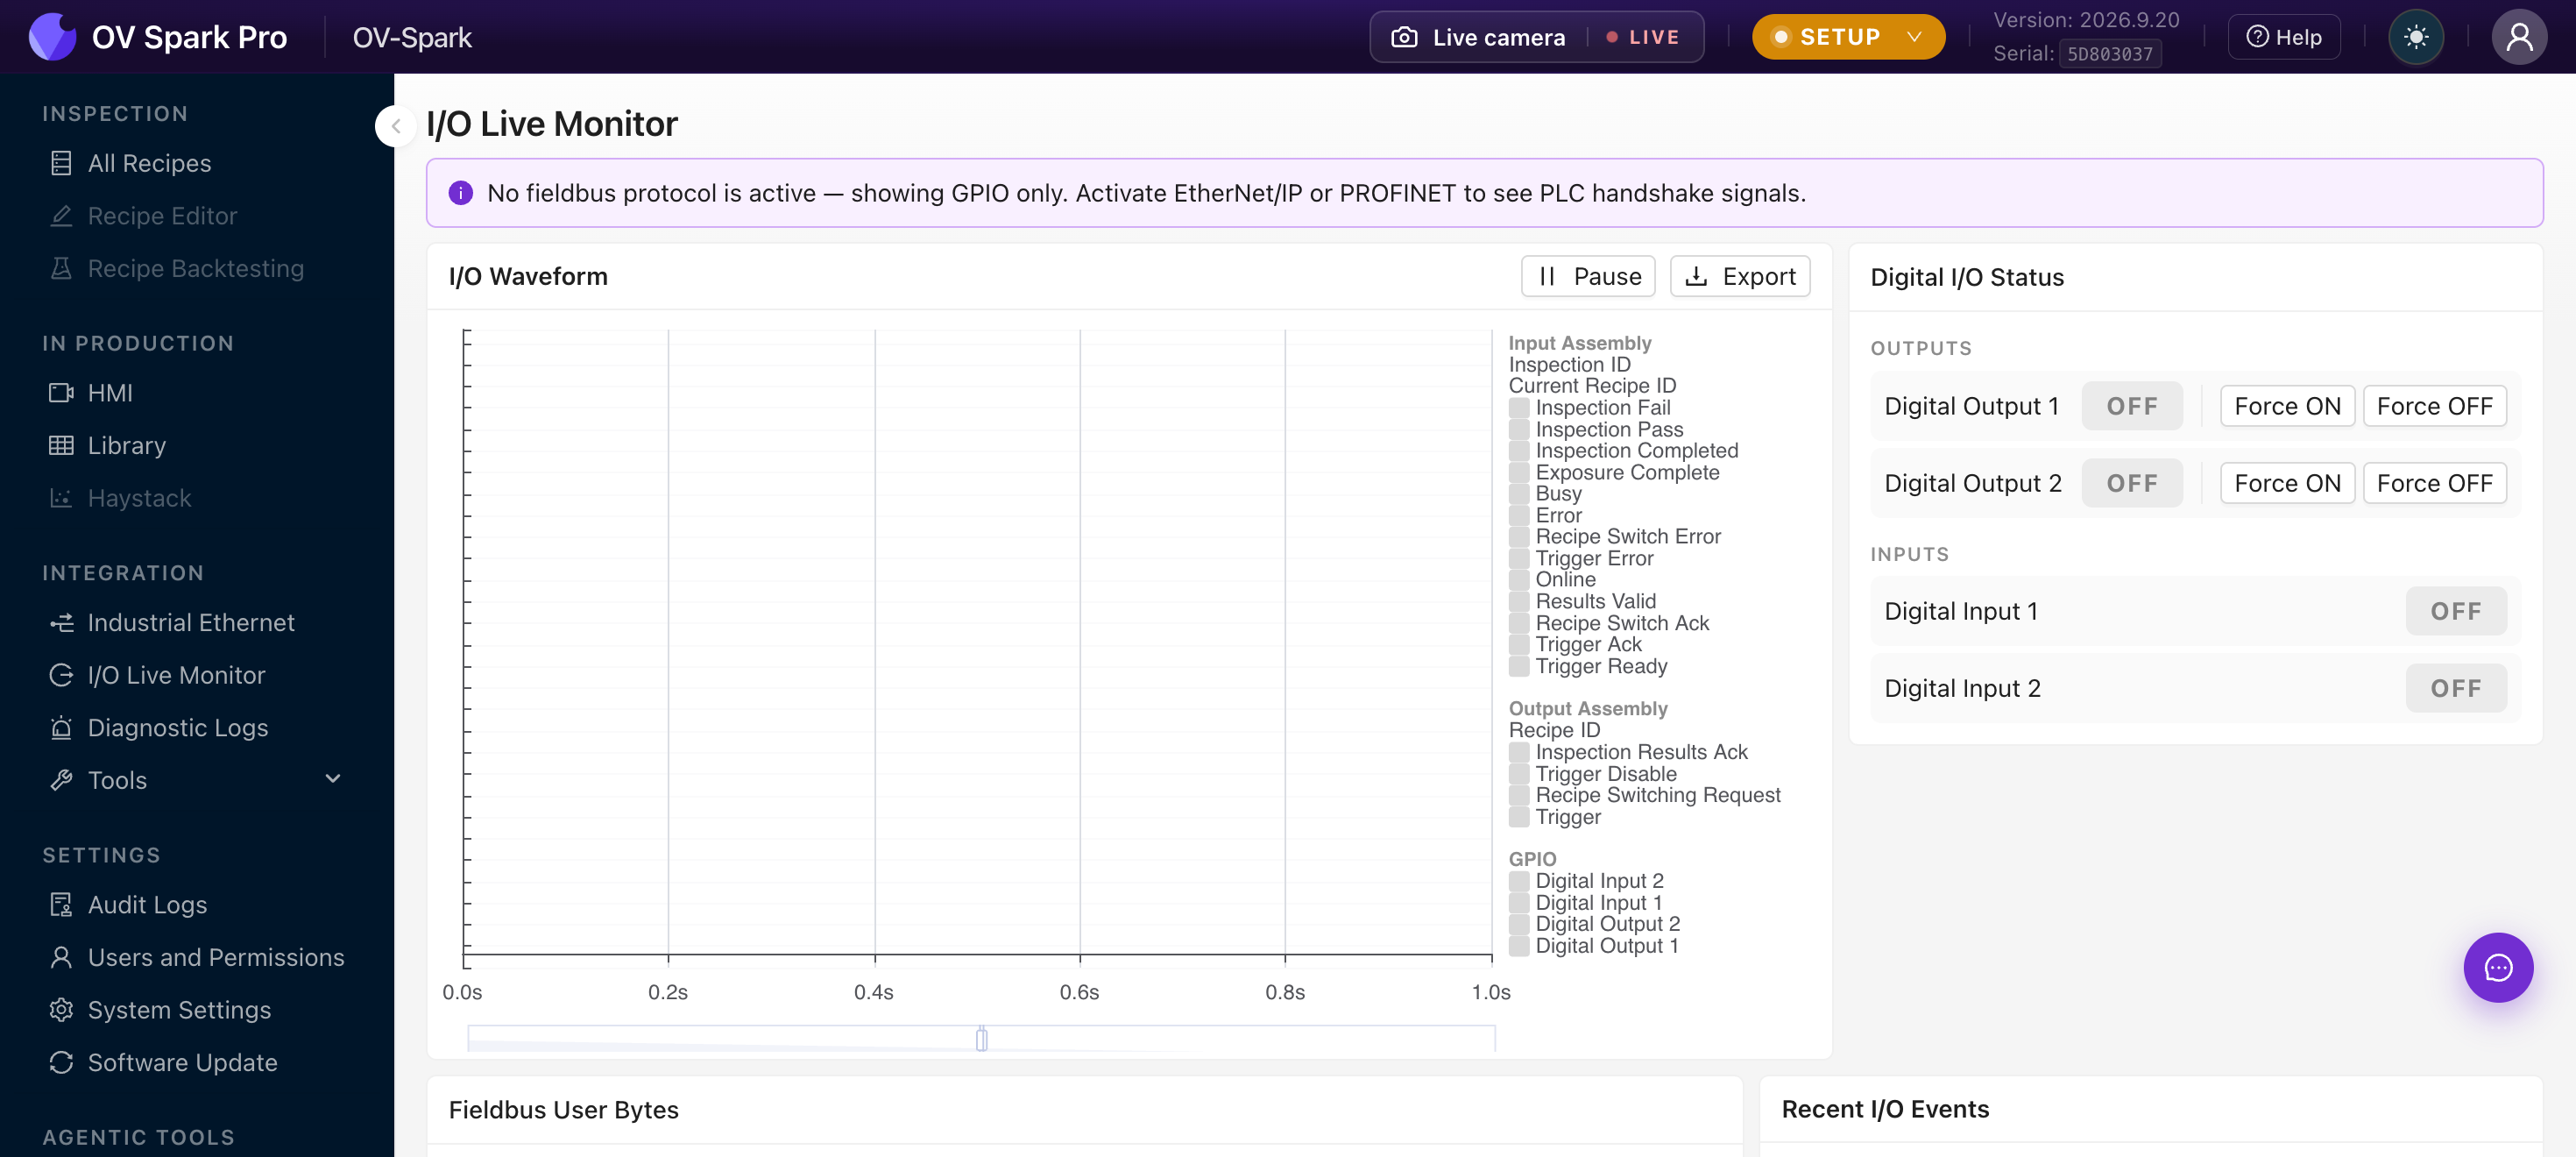
The waveform
Signals are grouped into three track sets:
| Track group | Contains |
|---|---|
| GPIO | The physical pins on the M12 connector |
| Input Assembly | What the PLC is sending the camera |
| Output Assembly | What the camera is sending the PLC |
Controls: Follow keeps the view pinned to live, Pause holds it still, and Export saves the trace. Zooming by hand automatically drops out of Follow, so you can examine an event without it scrolling away.
Spans where the fieldbus Trigger Error bit is high are shaded red, which usually makes the problem obvious without reading a single value.
With no protocol active, an info banner explains that only GPIO is shown. Activate EtherNet/IP or PROFINET in Industrial Ethernet to see PLC signals.
Digital I/O status
A panel lists each input and output with its current ON or OFF state and how long it has been in it.
The buttons are present, but pressing one reports that forcing is not supported by the camera yet. Until the GPIO force endpoint ships, test output wiring by running an inspection that produces the verdict you need, or by having the PLC drive the device directly.
Reading common problems
The camera never triggers
Watch the trigger input while the sensor fires.
- No edge on the GPIO track: the problem is upstream. Check wiring, sensor power, and the NPN/PNP setting against Pinouts
- Edge present, no inspection: the camera saw it but rejected it. Check the trigger mode in the recipe and look at Diagnostic Logs
Results arrive late, or for the wrong part
Compare the trigger edge with the output change. The gap is your real inspection time. If it is longer than the spacing between parts, the line is outrunning the camera and results will lag behind the part in front of the gate.
The PLC reports errors
Red shaded spans mark the Trigger Error bit. The most common cause is triggering while the camera is still processing the previous inspection, which Diagnostic Logs records as a trigger while busy event.
This screen is the fastest way to end a disagreement between the controls engineer and the vision engineer. Either the signal is on the wire or it is not, and the waveform settles it in seconds.
Recent I/O Events
Below the waveform is a derived list of edges. Clicking one centres the waveform on that moment, which beats hunting for a transition by dragging.