AI-POWERED DOCS
What do you want to know?
HMI (Operator Screen)
The HMI is the screen the operator actually watches. It is a configurable grid of widgets showing the live feed, the verdict, running counts and recent results, sized to fill a monitor at the cell.
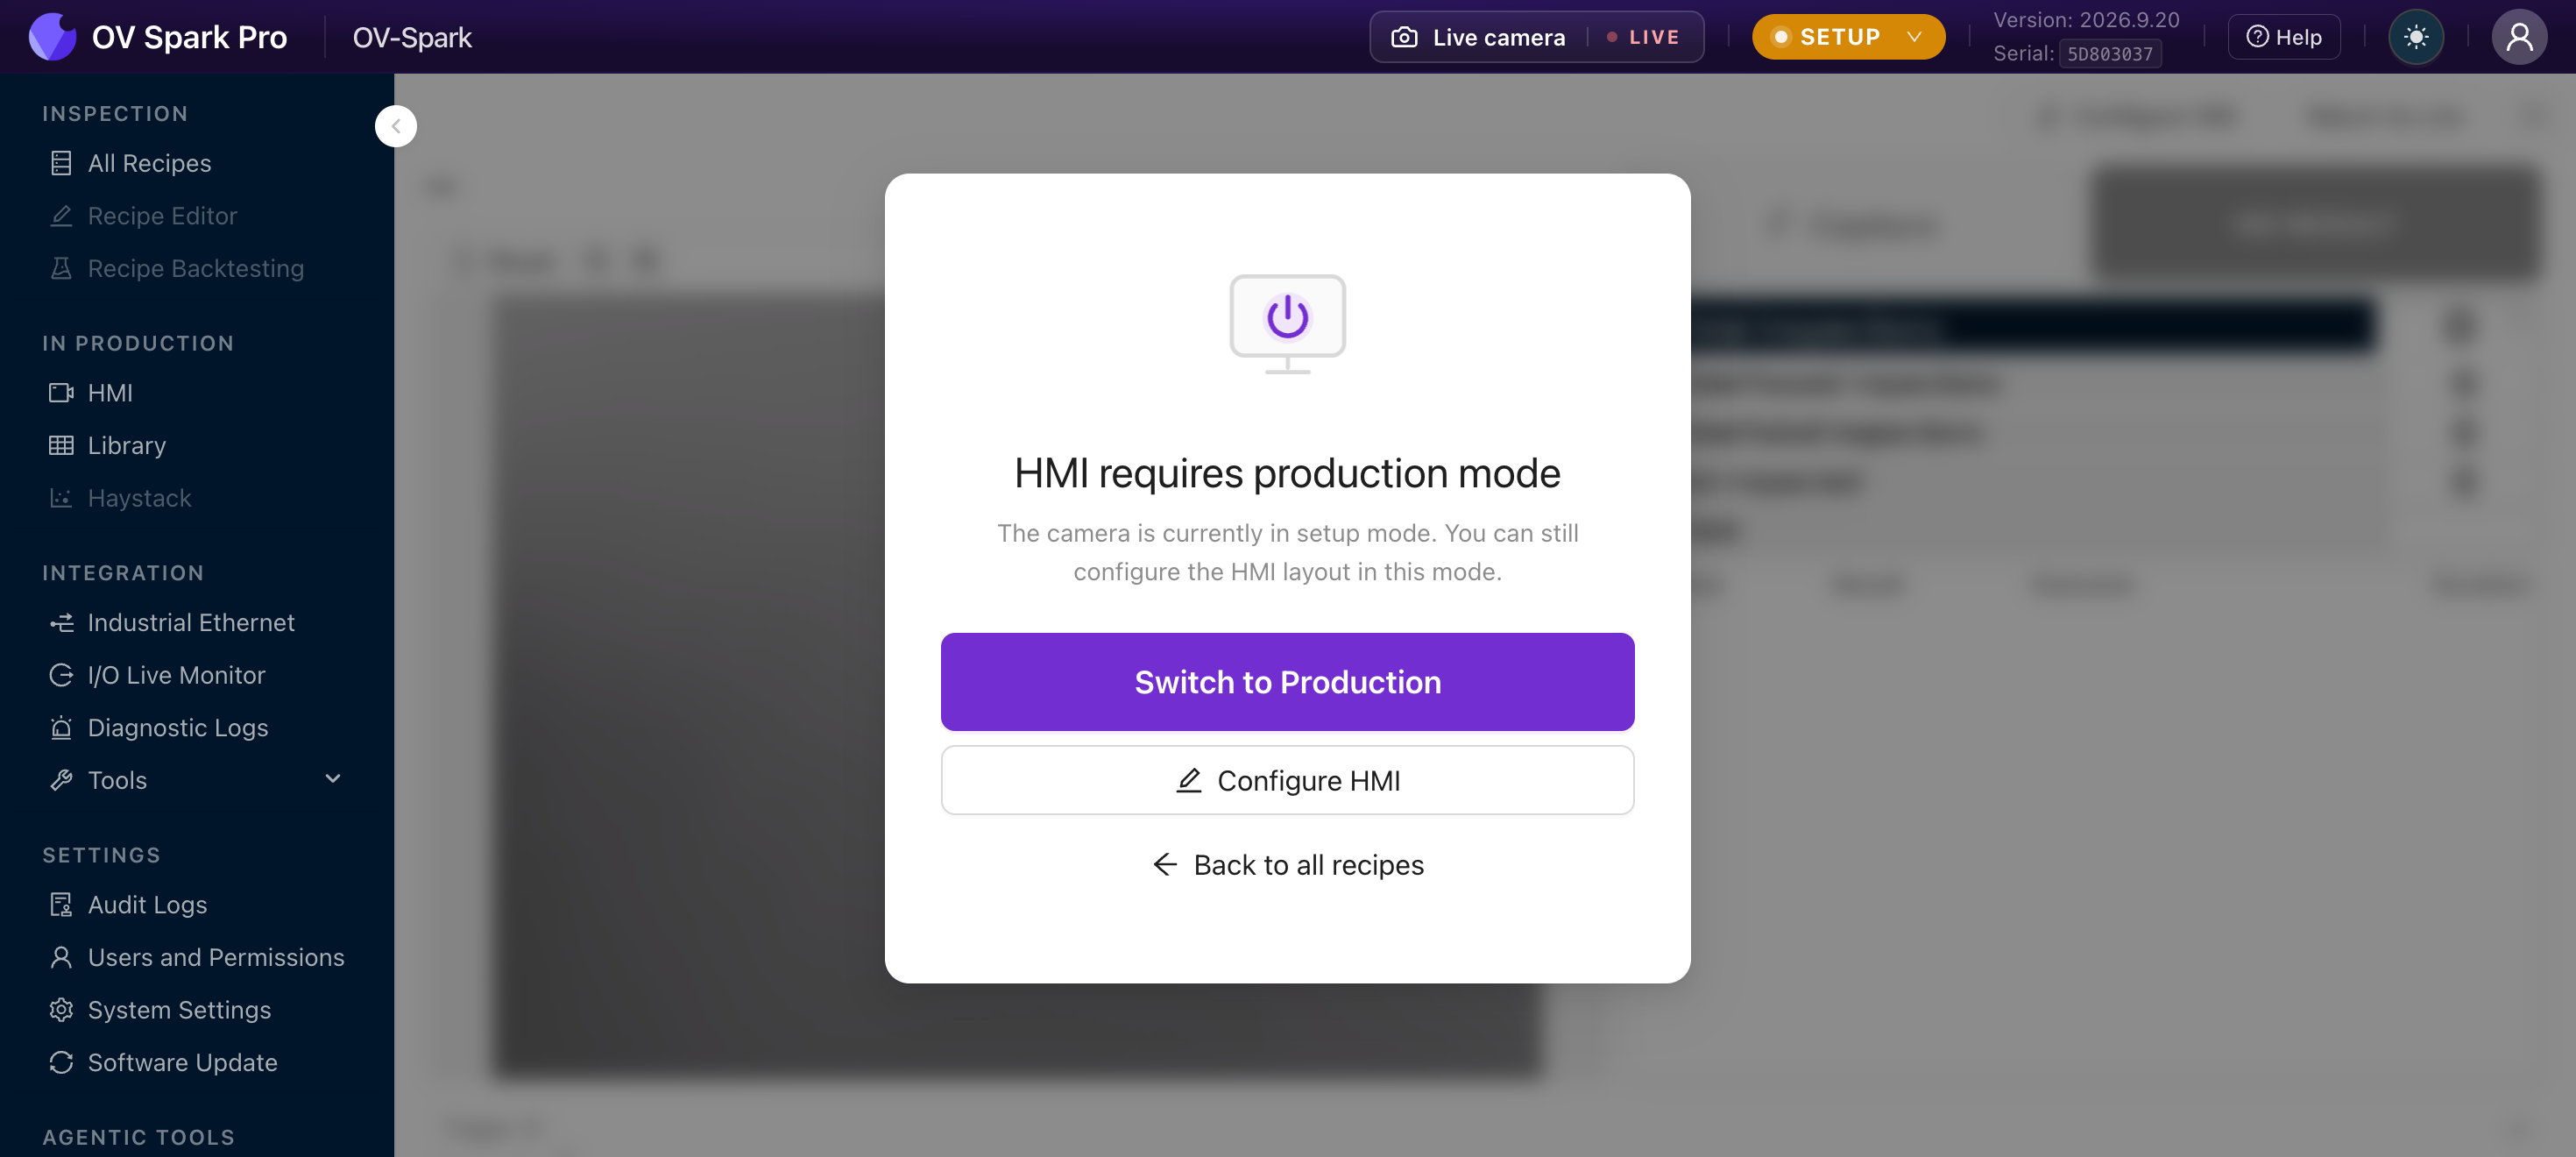
In Setup the page is blurred with HMI requires production mode. You can still build and save the layout in Setup, which is the sensible way to prepare a screen before a shift starts.
Build the screen
Configure HMI opens the editor. The header tells you what you are working with, such as 7 widgets · 32 x 20 grid, and the canvas becomes a snap grid you drag tiles around on.
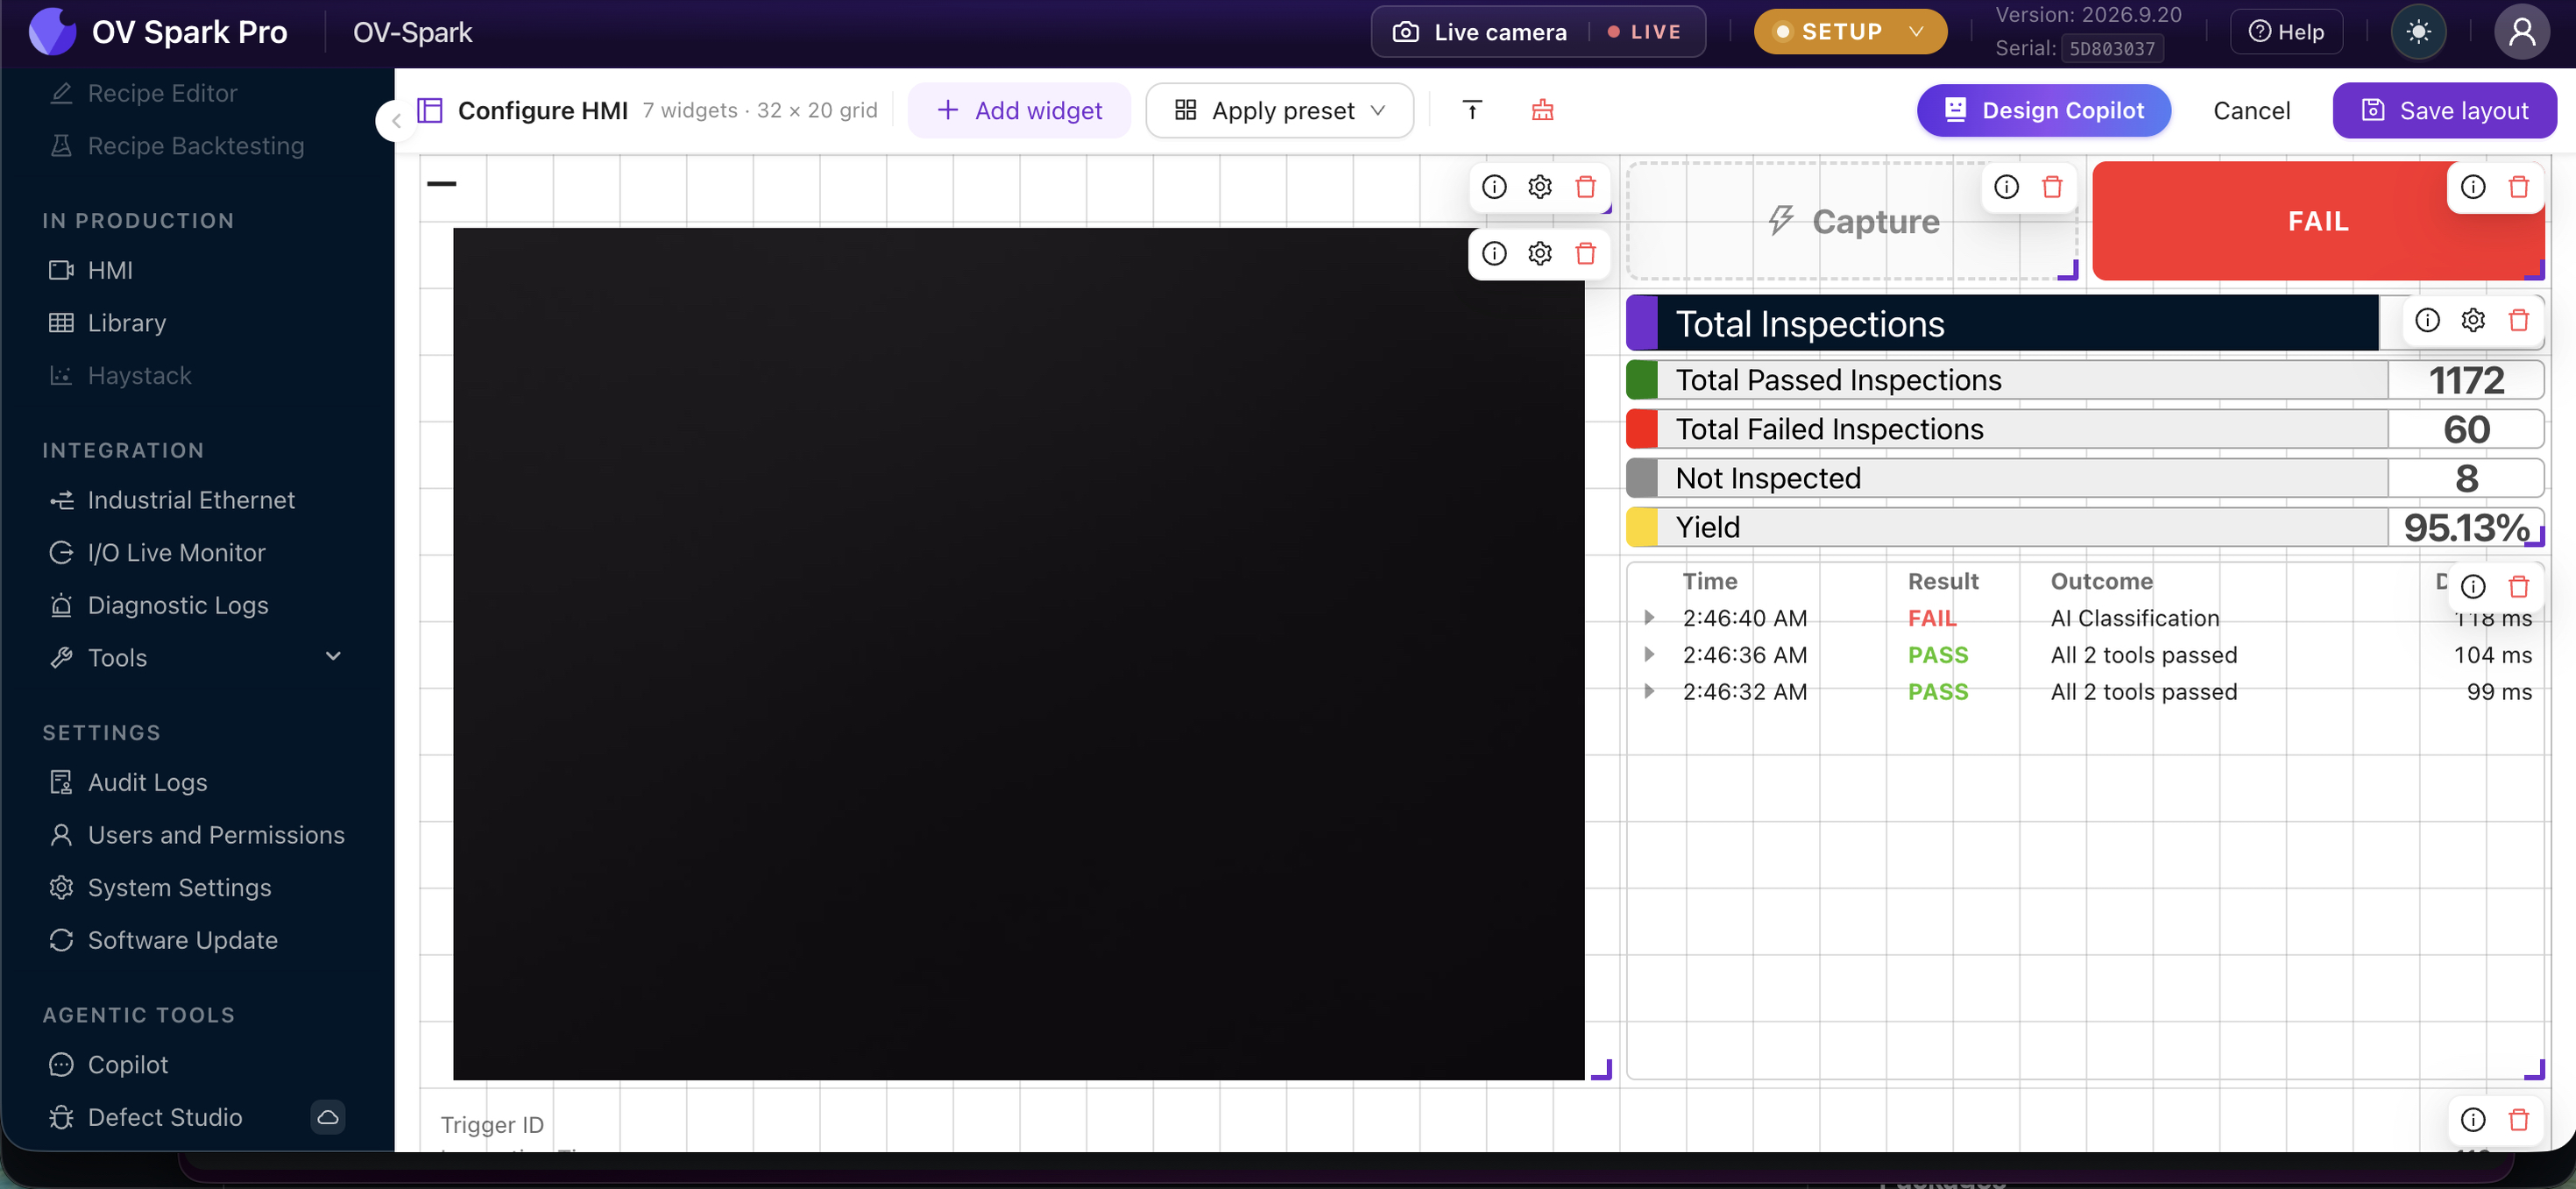
| Control | What it does |
|---|---|
| Add widget | Place a new tile |
| Apply preset | Start from the Classic layout |
| Compact | Pack tiles upward, removing vertical gaps |
| Clear all | Empty the grid |
| Sparky | Describe the screen you want and have it laid out for you |
| Cancel | Discard changes |
| Save layout | Commit the change |
Each tile carries three controls in its corner while you are editing:
| Icon | Action |
|---|---|
| i | Widget info, explaining what that tile shows |
| gear | Widget settings, where the tile has any |
| bin | Remove the widget |
Drag a tile to move it, and drag the corner handle to resize it. Tiles snap to the grid, so a layout built this way stays aligned when the screen it runs on is a different size.
The layout editor works in both phases, but the live feed only runs in Production. Lay the screen out during changeover, then switch phase and let it run.
What a real screen looks like
The layout above is a good starting point for most cells, and worth copying:
- Live feed takes the left half, large enough to see the part from a few feet away
- Capture and the verdict sit top right, so the operator's eye lands on PASS or FAIL first
- Inspection Stats runs down the right side as a labelled list: Total Inspections, Total Passed, Total Failed, Not Inspected, and Yield as a percentage
- Recent Results fills the bottom right with Time, Result, Outcome and duration per inspection, so a failure is traceable without leaving the screen
The Outcome column is the useful one during a problem. All 2 tools passed against AI Classification tells the operator which tool rejected the part, which is the difference between "the camera is failing things" and "the classifier needs another look".
The Sparky button lets you describe a layout in words rather than dragging tiles. It needs the cloud model configured, and is disabled with a tooltip saying so if it is not. See Sparky.
The layout is a device setting. Changing it changes what every operator on every screen sees. If someone else edits it while you are working, you get a Layout changed elsewhere conflict with the option to reload.
The widgets
| Widget | What it shows |
|---|---|
| Live Camera Feed | The running image, annotated or clean |
| Verdict | Large PASS, FAIL or NO RESULT |
| Inspection Stats | Totals, yield, average inspection time |
| Recent Results | The last several verdicts |
| Filmstrip | Thumbnails of recent captures |
| Pareto | Which failure dominates |
| Capture Metadata | Details of the current capture |
| System Info | Camera identity and state |
| Recipe Name | Which inspection is running |
| Date & Time | Clock |
| Custom Text | Your own label, such as a cell or line number |
| Capture | A manual trigger button, Production only |
What to put on an operator screen
Keep it to what someone can read at a glance from a few feet away, while doing something else with their hands.
A good default is Live Camera Feed, Verdict, Inspection Stats and Pareto. The feed and verdict answer what just happened, the stats answer how is the shift going, and the Pareto answers what should we fix first.
"The camera keeps failing parts" is hard to act on. A Pareto showing 70% of failures come from one tool on one region is a job you can assign.
Stats
The Inspection Stats tile reports Total Inspections, Total Passed, Total Failed, Not Inspected, Yield and Average Inspection Time.
Not Inspected is worth explaining to operators: it counts captures where every tool was skipped, which in practice means alignment failed and the camera refused to guess. It is kept out of the yield figure deliberately, because those parts were never actually judged.
Reset statistics clears the counters and asks for confirmation. Operators are allowed to do this, which suits a start-of-shift reset.
Freezing and unfreezing
The view freezes on each inspection so the operator can see what happened. Return to Live unfreezes it, and it re-freezes on the next inspection.
Overlays
The Overlays popover controls Sources, Shapes and Status overlay, and lets you choose the Annotated or Clean feed.
The popover says so explicitly: this is a camera setting, so it changes the annotated feed on every screen, not just this tile.
That is all 13 steps. The camera is inspecting.
From here, Library holds every capture for when someone asks why a part failed, and Troubleshooting is the first stop when the line misbehaves.